Key insights
Corporate volunteering has been steadily gaining momentum in recent years. What began as a slow rebound after the COVID-19 pandemic has evolved into one of the fastest growing engines of corporate purpose — yet also one of the most difficult to scale and manage for the small teams who lead these programs. Benevity data reveals a lot of positive trends and some contradictions. Intentionally confronting these tensions will be the key to unlocking a future where corporate volunteering is truly delivering on the needs of today.
Participation in corporate volunteering is rising, but impact isn’t following
On the surface, the state of corporate volunteering looks positive as all of the traditional success metrics continue to climb. Even while accounting for the growing number of employees on the Benevity platform, we see substantial growth in approved volunteer hours and unique volunteers.
Total volunteer hours per year
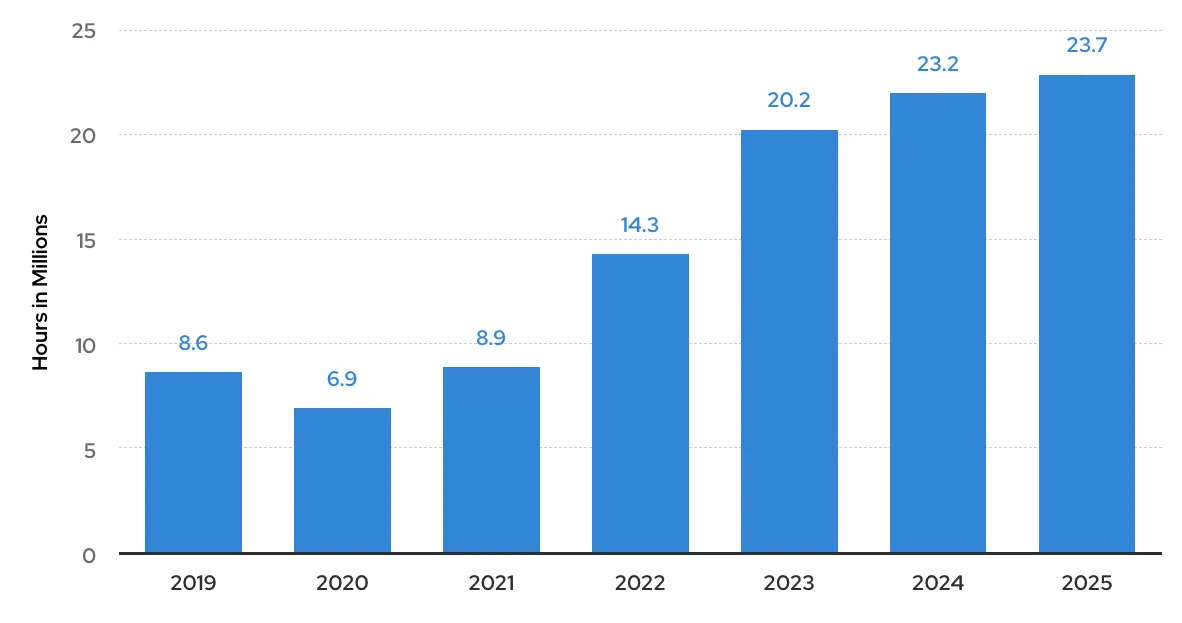
Approved volunteer hours have grown 175% in six years, reaching a record 23.7M in 2025.
Volunteering participation rates by year
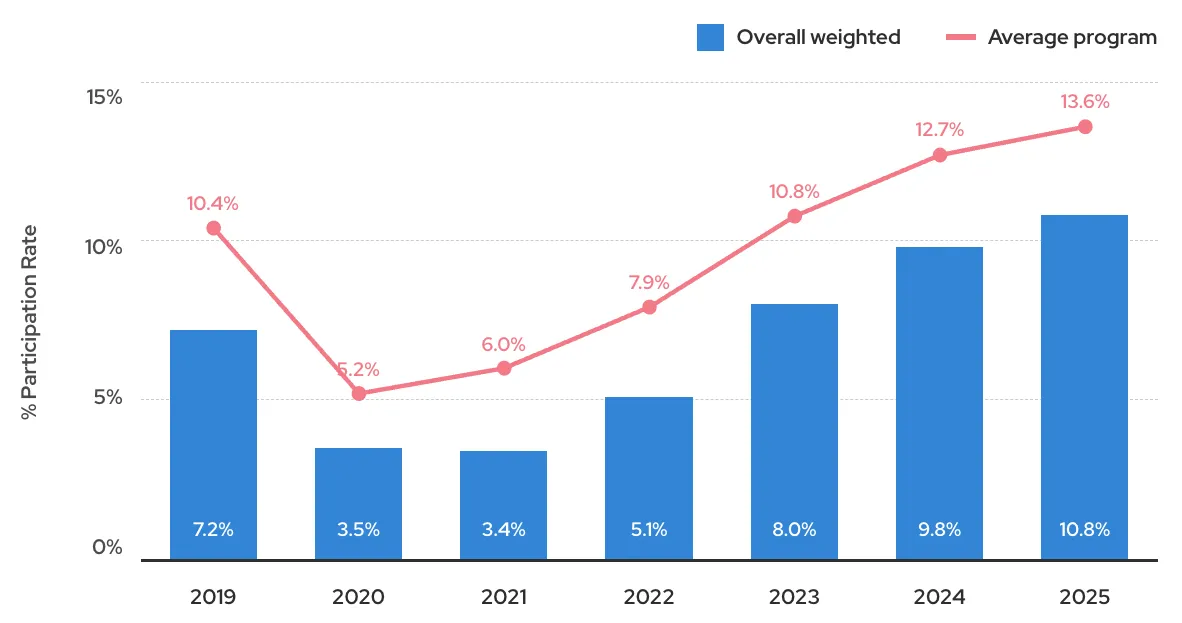
Average volunteering participation rates have grown by 30% since 2019.
Unique individuals volunteering by year
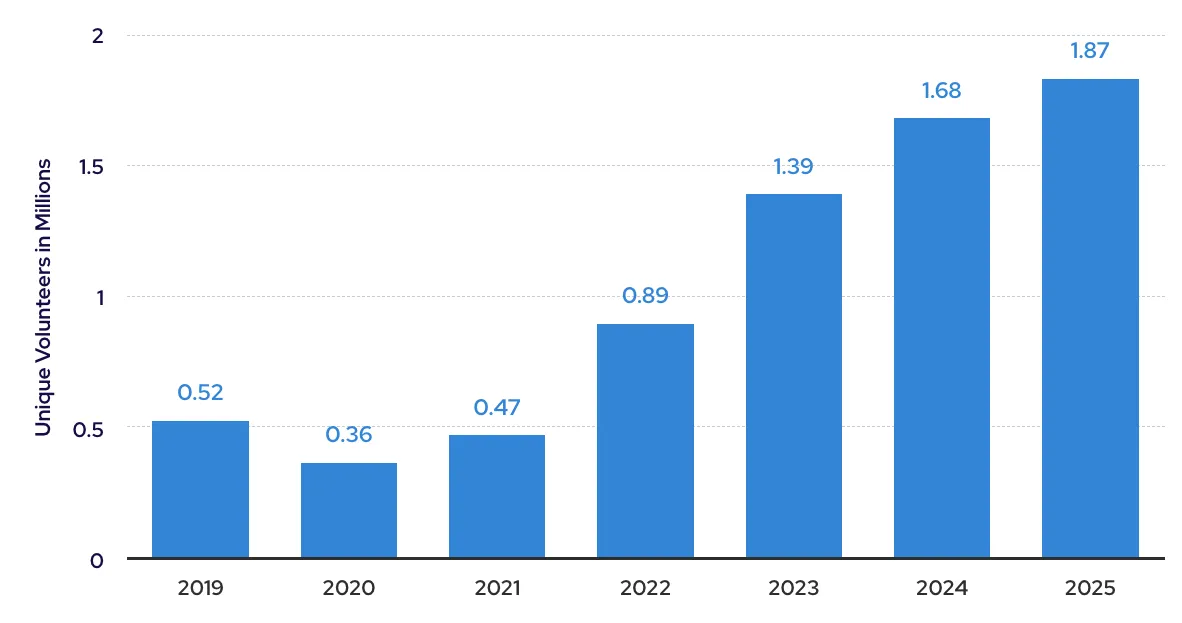
The number of unique volunteers has more than tripled to 1.87M since 2019.
The time and intensity of employee volunteering is declining
Employee volunteering surged beginning in 2019, with a sharp acceleration in 2022 that coincided with a large-scale return to office and increased corporate investment. But when we zoom in, there is a more nuanced story emerging below the surface — the way people volunteer is changing. From 2019 to 2025, hours per volunteer dropped by 23% from 16.4 hours to 12.7 hours.

Introducing the micro-volunteer
We are witnessing an emerging phenomenon that we are calling "the rise of micro-volunteers." These are employees who are volunteering less time with less frequency than regular volunteers.
- Micro-volunteers accounted for 12% of all volunteers in 2019. By 2025, it was 25% of all volunteers.
- Despite the number of micro-volunteers doubling in six years, they are being outpaced in hours by regular volunteers by 11x.
- On average, micro-volunteers only submitted about 1.4 hours of volunteer time in 2025 across 1.7 time submissions; comparatively, regular volunteers submitted an average of 16.5 hours across 3 submissions.
This rise of micro-volunteers offers volunteer program managers the opportunity to reflect on whether they wish to consider different engagement strategies for this segment.
Volunteering commitment by hours
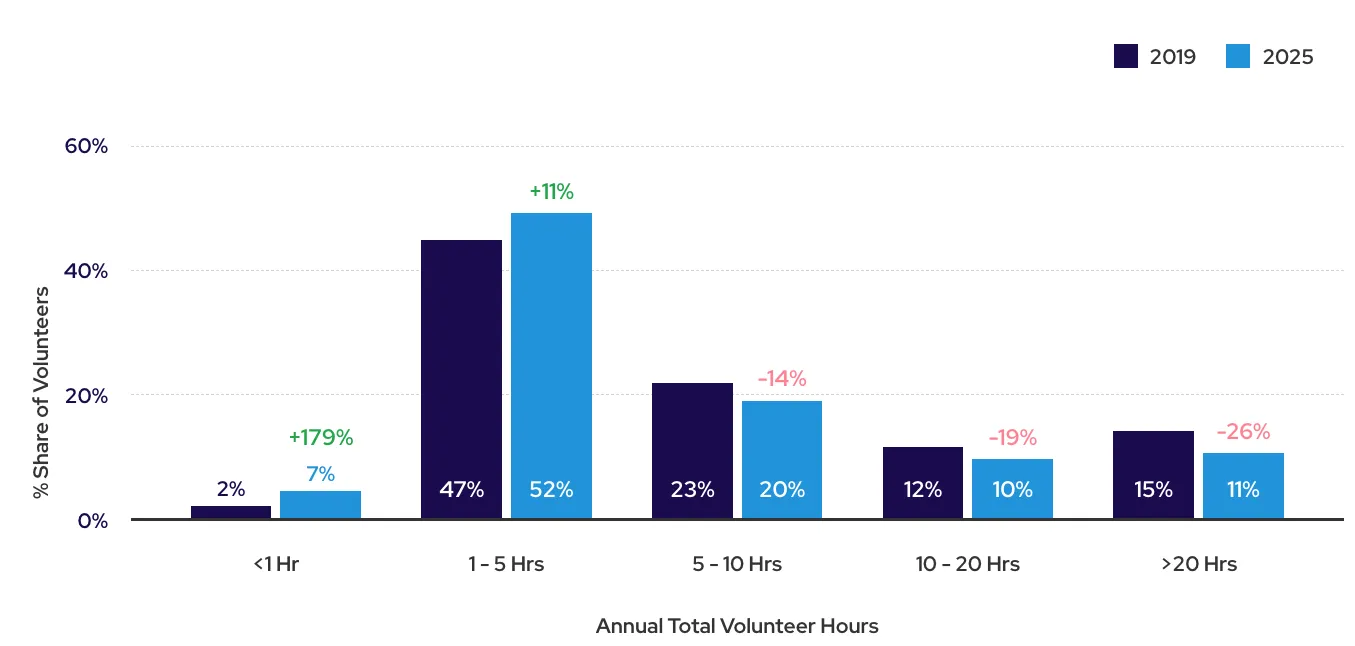
Comparing 2019 to 2025, employee volunteering totalling less than one hour grew from 2% to 7%, and volunteering totalling between one and five hours grew from 47% to 52%. Totals of more than five hours all shrank. This clearly shows an emerging employee preference towards shorter, bite-sized volunteer opportunities at less frequency.
Part of the shift we're seeing in volunteering could be attributed to the trend towards virtual opportunities, which tend to involve shorter time commitments than in-person opportunities. In 2019, only 26% of volunteer hours logged were for virtual volunteer opportunities. That quickly spiked to 75% for 2020 and 2021, in the height of the disruption caused by the pandemic. As that disruption has subsided, virtual volunteer opportunities accounted for 50% of hours logged in both 2024 and 2025.
However, Visit.org post-event surveys demonstrate that it is accessibility — rather than duration or setting — that drives employee sentiment. High impact scores (4.3-4.4 out of 5) remain consistent whether engagements are under one hour or longer and across virtual and in-person formats. This parity supports a diversified portfolio approach, with a flexible mix of opportunities that align with modern employee expectations for choice and autonomy.
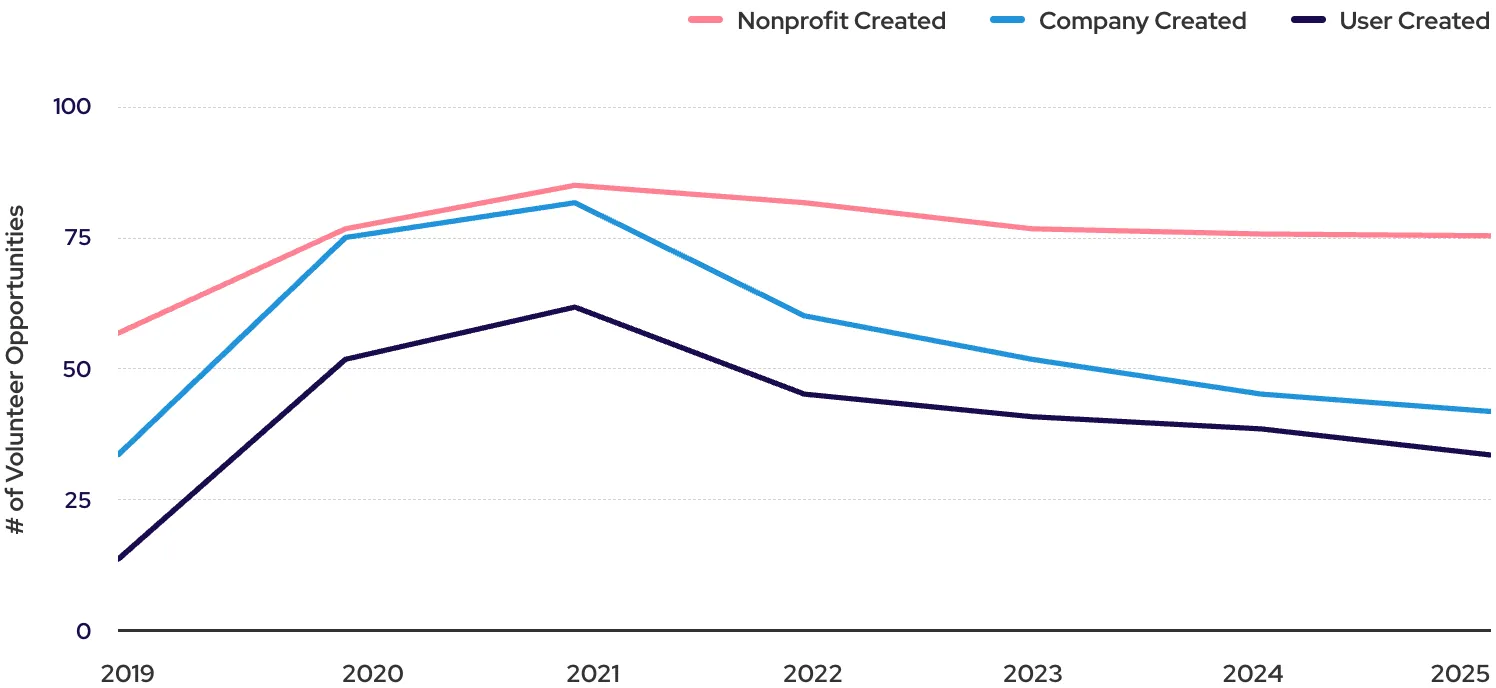
Share of created volunteer opportunities that are virtual (no location)
If we're seeing more new volunteers and more volunteer hours being submitted, why is volunteering depth declining?
- Generational shifts: As new generations become the majority of the workforce — and older ones move on — they are redefining engagement by participating in frequent micro-volunteering and alternate activities such as posting on social media about causes and nonprofits over traditional long-term commitments.
- Time and financial scarcity: While the rise in participation is a testament to the enduring desire for purpose and connection, the decline in depth suggests a workforce bumping up against its limits. Employees, faced with increased economic and employment pressure, as well as shifting hybrid work demands, are opting for shorter, episodic engagements rather than sustained commitments. According to a study by Minehead & District U3A, nearly 38% of workers now report putting in unpaid overtime every week, up sharply since 2018, and up to 76% of volunteers report dipping into their own funds regularly to support their volunteering efforts.
- Office-based events: Office-based "volunteer days or months" still play a large role in corporate impact programs. From 2019 to 2025, Benevity data consistently shows that 21% of companies are running dedicated periods of service where employees from across the company are encouraged to give time. While these events are major drivers of participation, they tend to be "one and done" opportunities that lead to higher volunteer attrition rates and lower hours per volunteer.
While new volunteers surged, retaining them remains a challenge
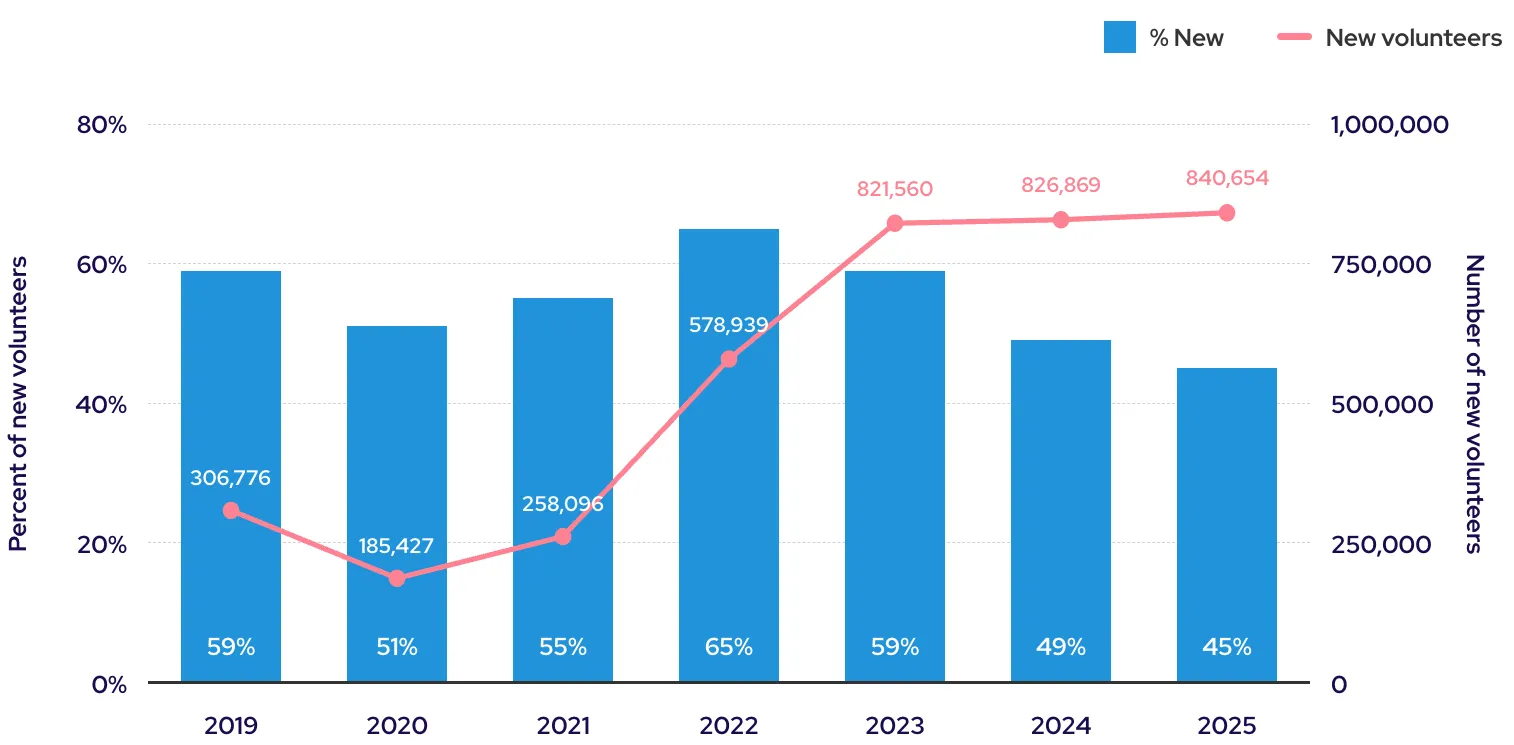
Steady growth in new volunteers coming out of the pandemic shows that the focus on participation is successfully filling the top of the funnel. New volunteers represented 51% of total volunteers in 2020, and that number grew to a peak of 65% in 2022 before leveling off at 45% in 2025. More first-time volunteers are contributing to a record number of approved volunteer hours. But when those volunteers don't show up to volunteer again, it results in a "leaky bucket" where filling the funnel with volunteers doesn't actually create growth.
Percent of new volunteers (first time ever volunteering)
So why is volunteer participation seemingly improving, while retention is lagging?
- Program design: Low-barrier opportunities create an easy point of entry for first-timers — in 2025, 35% of new volunteers started with a Volunteer Act of Kindness (VAOK). But many corporate impact programs lack the follow-through for sustained engagement. Without offering clear pathways for volunteers to continue their engagement, there is risk of creating a revolving door that prioritizes breadth over depth.
- Participation measurement: When companies measure their success on participation, large one-time events that attract a lot of volunteers will often fulfill their goal on a single day, so there is less focus on continued engagement and encouragement of repeat volunteers.
- Evolving motivations of volunteers: The motivations for first-time volunteers are fundamentally different from those that keep people coming back. First-timers may begin their engagement seeking social connection, while return volunteers may be seeking skill development or being a critical resource for a nonprofit or finding a cause that feels connected to their personal identity.
| Year | Prior year attrition |
|---|---|
| 2020 | 66% |
| 2021 | 42% |
| 2022 | 33% |
| 2023 | 36% |
| 2024 | 36% |
| 2025 | 39% |
Best practices in managing program health
While participation remains a key measure for employee volunteer programs, leaders benefit when they expand their key performance indicator (KPI) set to include the following measures so they can ensure that while they grow their programs, they are mitigating the risk of lessening their overall impact.
- % participation rate
- % and count of new volunteers
- % and count of repeat volunteers
- Median and average # of hours/volunteer (Consider evaluating by employee segments, identifying outliers at the high and low ends that could be skewing averages.)
Corporate priorities and nonprofit needs are diverging
Corporations remain focused on employee volunteering, as seen in their program design, budget allocation and sentiment towards volunteering as a pillar of employee engagement. And nonprofits need volunteers — but not just more of them. While 47% of nonprofits rely primarily or entirely on volunteers and 60% say they cannot function without volunteers, that doesn’t mean the surge in corporate volunteering is focused on where nonprofits need the most support. It is specific kinds of volunteers that make all the difference — those with the right skills, capacity, commitment and engagement to fill nonprofit gaps where they occur.
Companies anticipated an increase to their budgets for volunteering
Data from the Benevity 2025 State of Corporate Purpose Report
Data from nonprofit leaders
There is an opportunity for corporations to rethink and reframe how they deploy employee time. By reframing volunteer time off (VTO) from a participation benefit to a skills-based development opportunity, companies can deliver deeper impact for nonprofits while enabling employees to bring back skills and insights that can directly benefit themselves, their teams and the business.
Coming together on the “why” of volunteering
Employees are looking for more meaningful, relevant volunteer opportunities. In a 2024 survey by Deloitte, 95% of respondents said it is important to them to make a positive impact in their communities, with 52% saying the best way for their company to support them is by organizing in-person opportunities with community organizations.
It seems there’s a natural fit between what companies, employees and nonprofits want — engaged employees, relevant volunteer opportunities and skills-based volunteers. And when companies invest more in creating these skills-based opportunities, the needs of all parties can be met. Taproot reports a 44% increase in new volunteers from 2024 to 2025, while applications for skills-based volunteer programs grew by 60% among unique volunteers.
GE Appliances increases donations to nonprofits by 15% using skills-based volunteering
How volunteering drives funding
As the need for skills-based volunteering becomes increasingly clear, many nonprofits remain committed to accepting all corporate volunteers because of the correlation between volunteering and donations. While volunteering remains one of the top priorities for corporate impact programs, nonprofits list funding as a much bigger strategic priority.
Given the strong overlap between volunteering and giving, companies have an opportunity to lean into both by continuing their commitment to corporate volunteering, and using their participation numbers to boost giving at the same time.
For volunteers who are less inclined to donate out of their own pocket, volunteer rewards programs provide them with the means and the incentive to give. Volunteer rewards are also a nearly universal precondition to having strong volunteering participation and time tracking. Benevity data shows that the average number of hours per volunteer is 50% higher in companies that offer rewards. Some companies provide a grant to nonprofits to run their volunteering programs and events; this recognizes and places a value on the time it takes for nonprofits to manage volunteers when they could be otherwise fundraising.
Volunteering drives business value, but we're not measuring what matters
Volunteering drives value for business, individuals and society at large. We know this intuitively, but many of us lack the data to prove it. Understanding what to measure and how to measure it starts with understanding what these programs are trying to achieve in the first place. This thinking provides us with a major opportunity to build on participation metrics to include real outcomes.
The measurement gap — participation vs. impact
The current design of our volunteering programs was a response to a tumultuous time. During the pandemic, companies needed to drive employee engagement as workforces shifted to work-from-home and hybrid set-ups, and knew volunteering was a key leverage point in maintaining connection and culture.
But truly understanding the effectiveness and impact of volunteer programs requires moving beyond the status quo. While measuring participation and total volunteer hours is standard and ubiquitous, fewer companies go beyond.
- 67% of companies systematically track employee volunteering participation rates
- 47% survey for the sentiment of their employees / participants
- 24% of companies survey nonprofits about the actual impact of their volunteering programs
This gap, between what volunteering accomplishes intuitively and what is actually being measured, creates a barrier to investment and requires a rethink.

Community engagement is increasingly considered a tool that drives innovation. From 2022 to 2025, Points of Light has identified that the percentage of The Civic 501 honoree companies that align their volunteering program with research and development/innovation has increased from 44% to 64%.
1. The Civic 50®, an initiative of Points of Light, recognizes the 50 most community-minded companies in the United States.
Design and measure your programs based on the impact you want to have
To design effective volunteer programs — ones that benefit companies, employees, nonprofits and communities — volunteer strategy must be anchored to business strategy. This could look different for every company. For some, the desired outcome will be social impact. For others, employee learning and development, culture, talent attraction and retention, or other motivations. And for many, it will be a combination of social and business impact.
No matter the desired outcome of your volunteer program, your goals are a determining factor in designing how your volunteer program is structured and measured. Measurement could involve surveying employees and nonprofits, finding correlations between volunteer participation and job performance and satisfaction, tracking the number of repeat engagements and more. Here are some ideas to help you connect your program goals to what you measure to determine its effectiveness.
| Impact Area | Why it matters | What to measure |
|---|---|---|
| Culture & Connection | Transforms individual acts into collective experiences and connection. |
|
| Attraction & Retention | Strengthens employer brand through broader awareness of the program and understanding its influence on employees. |
|
| Learning & Development | Empowers individual growth while making a positive impact on communities. |
|
| Social Impact | Social impact requires depth, and long-term partnerships lead to better outcomes. | Ask nonprofits:
|
| Business Innovation & Creativity | Programs can be an innovation engine when they expose employees to new perspectives, contexts, constraints and communities. |
|
Volunteering is an evolving system
The story of volunteering today is one of growth and gaps. The corporate commitment is there, but the preferences of volunteers and the needs of nonprofits are rapidly shifting. And corporate teams are struggling to scale programs that have increasing complexity and nuance. What it leaves us with is an investment full of potential if we are brave enough to let go of existing models and mindsets to embrace new possibilities and new measures of success.
Read the blog: Corporate volunteering needs to change, and it starts with us.
Benevity would like to acknowledge our partners in the social impact space for their contributions to this report. At various points, references are made to statistics and findings from Goodera, Taproot, Points of Light, and Visit.org. We thank them for sharing and clarifying information in support of this effort.
The bulk of this report is based on proprietary data, transactional platform analytics, and quantitative surveys conducted by Benevity Impact Labs. The insights presented are synthesized from the following primary research sources that in many cases formed the basis of their own standalone reports:
- The State of Corporate Purpose Surveys (2025 & 2026)
This annual survey is conducted via an online survey fielded in December/January. The dataset includes respondents from our client base or practitioners and social impact professionals from a general population panel. Respondents primarily consist of CSR, HR, and purpose professionals representing a diverse range of global industries and company sizes. - Nonprofit Perspectives Survey (Spring 2025)
This online survey was conducted from March 26 to April 2, 2025. The survey was distributed via Benevity's B-Cause newsletter to over 192,000 nonprofit organizations across the United States, Canada, the United Kingdom, Australia, and India. - FY26 Nonprofit Experience Survey (Fall 2025)
This comprehensive global survey was conducted in September/October 2025. It captured 1,458 responses from nonprofits worldwide, with the highest participation from the U.S. (48.4%), Canada (11.3%), and Germany (10.2%). To ensure global representation, the survey was translated into German, French, Italian, Portuguese, and Spanish. - The Benevity Goodness Engagement Study (2018)
This quantitative behavioral study analyzed a global transactional dataset of 2,093,593 users from 118 enterprise companies. - The Benevity Talent Retention Study (2022)
This large-scale, longitudinal behavioral study analyzed a global dataset comprising 10.6 million users from more than 400 enterprise companies utilizing the Benevity platform.
Benevity Platform Data: Aggregated and anonymized transactional data from the Benevity platform is utilized extensively to measure corporate volunteering participation and engagement in myriad direct and indirect ways. All volunteer hours are approved by administrators and any references to donations include only those finalized and committed. Individuals are isolated and analyzed using anonymous identifiers. Unless otherwise stated, all monetary references are in $CAD.
Additional Sources: Finally, at various points in this report, we have mentioned statistics or findings from our reading and research in the field. The usage of those statistics or any inferences are not to be interpreted as broad endorsement nor partnership in either direction. It is merely an illustrative datapoint to highlight a phenomenon being discussed.